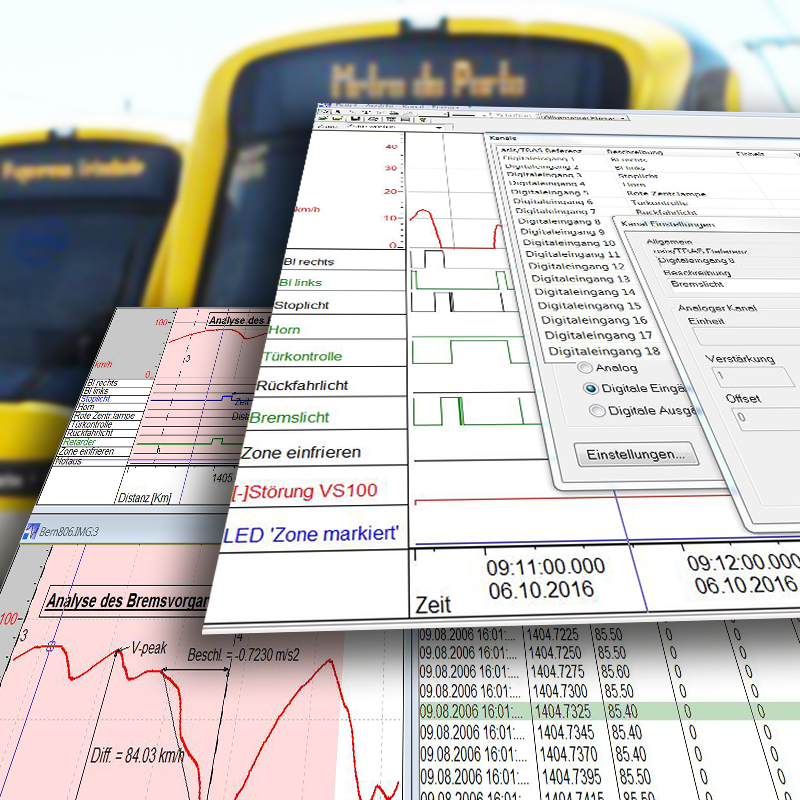
Analysis of driving data
- Graphic
- Tabular
- Text messenger for reports
- Export function
- Measuring functions
- Multi-graphic capability (multiple windows)
- Arbitrary positioning of the channels
- Signal name assignment
- Color assignment and line thicknesses
- Fonts
- Time and route axis
- Cursor linking across several windows (graphic and table)
- Graphically marked zones
- Display of CANopen text messages
- Display of the train number
- Valid header data (parameters and application program) for each data point.
For inquiries, please contact asis@synics.ch directly
asis charts